The Serviceable Obtainable Market (SOM) is the portion of your market you can realistically target and convert into customers within a short timeframe (6 months to 2 years). Unlike TAM (Total Addressable Market) or SAM (Serviceable Addressable Market), SOM focuses on what you can achieve now, considering your resources, sales capacity, and competition.
Accurate SOM analysis ensures your sales and marketing efforts focus on high-potential opportunities, driving growth efficiently.
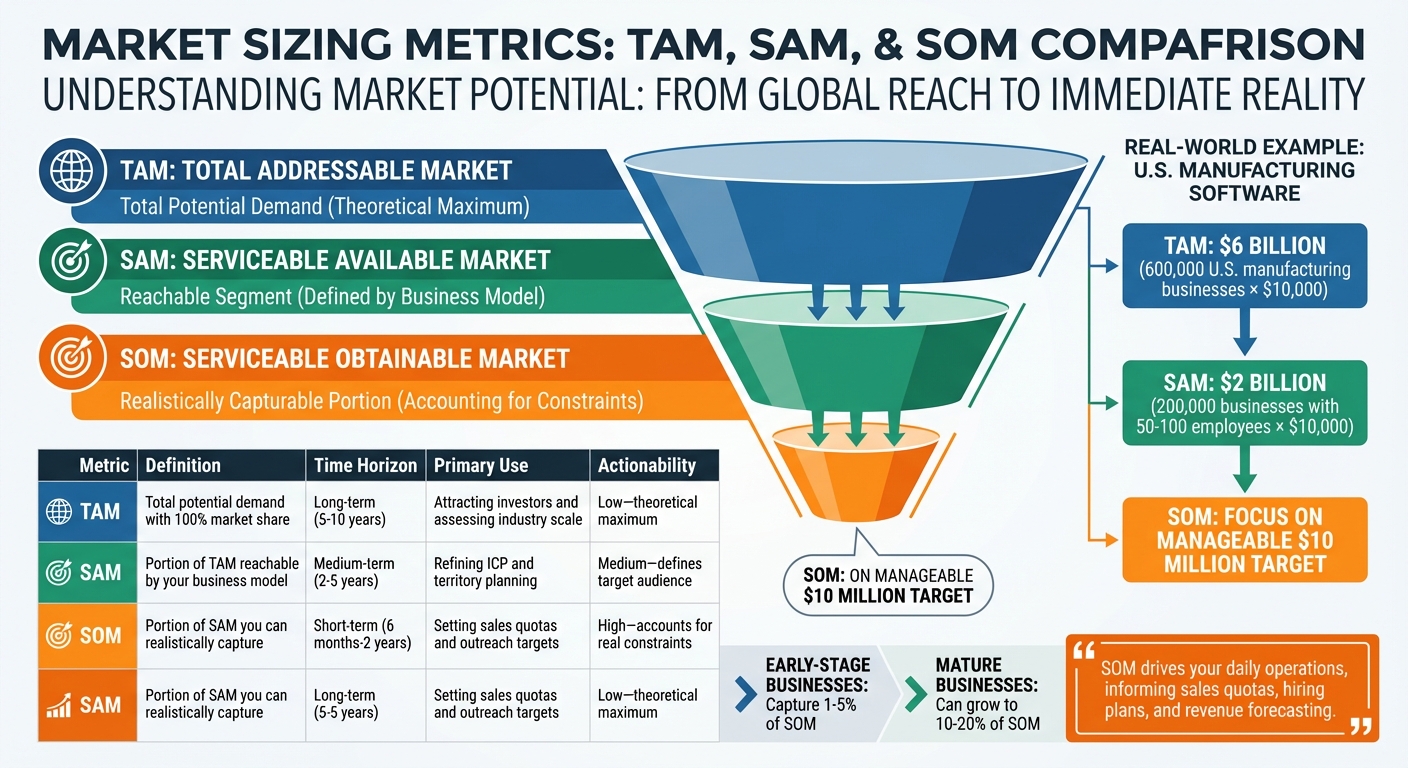
TAM vs SAM vs SOM: Market Sizing Metrics Comparison
TAM (Total Addressable Market) represents the total revenue you could generate if you captured 100% of the market without any competition. It’s essentially the entire pool of potential customers for your product or service. For instance, if you’re selling project management software to U.S. manufacturing companies, and there are 600,000 businesses willing to pay $10,000 annually, your TAM would be $6 billion.
SAM (Serviceable Addressable Market) is a narrower slice of TAM, focusing on the segment you can realistically serve based on your business model, geographic reach, and operational capabilities. Using the same example, if your software is tailored for manufacturers with 50–100 employees, the number of businesses fitting that profile might drop to 200,000, reducing your SAM to $2 billion.
SOM (Serviceable Obtainable Market) is the portion of SAM you can realistically capture in a short timeframe, typically within 6 months to 2 years. This metric factors in your sales capacity, marketing efforts, and the competitive landscape. As noted by Utmost Agency:
"SOM drives your daily operations, informing sales quotas, hiring plans, and revenue forecasting."
Together, these metrics help refine your sales strategy and set actionable goals.
| Metric | Definition | Time Horizon | Primary Use | Actionability for Sales |
|---|---|---|---|---|
| TAM | Total potential demand with 100% market share | Long-term (5–10 years) | Attracting investors and assessing industry scale | Low - represents theoretical maximum |
| SAM | Portion of TAM reachable by your business model | Medium-term (2–5 years) | Refining ICP and territory planning | Medium - defines target audience |
| SOM | Portion of SAM you can realistically capture | Short-term (6 months–2 years) | Setting sales quotas and outreach targets | High - accounts for real constraints |
This table highlights how each metric serves different purposes and timeframes, with SOM being the most actionable for immediate sales planning.
TAM, SAM, and SOM work like a funnel, narrowing from the broadest market potential (TAM) to the most specific, actionable target (SOM). TAM validates the overall market opportunity, SAM identifies the segment you can serve, and SOM focuses on what you can realistically achieve.
For early-stage businesses, capturing 1% to 5% of SOM is typical, but as your sales processes mature, this can grow to 10% or even 20% over time. Tools like AI and data intelligence can further refine these metrics, ensuring your efforts align with realistic goals. Instead of chasing an overwhelming $6 billion TAM, focus on the manageable $10 million SOM.
Here’s a real-world example: An enterprise cloud storage provider estimated the global TAM for 2025 at $80 billion. They concentrated on mid-to-large enterprises in North America and Europe, representing 40% of the market - or a $32 billion SAM. Based on their competitive strengths and past performance, they set a goal of capturing 5% of that SAM, equating to $1.6 billion within three years. This approach transforms an $80 billion market into a clear, achievable target.
(function(d,u,ac){var s=d.createElement('script');s.type='text/javascript';s.src='https://a.omappapi.com/app/js/api.min.js';s.async=true;s.dataset.user=u;s.dataset.campaign=ac;d.getElementsByTagName('head')[0].appendChild(s);})(document,372145,'tlb9tturzitublbka5ay');
Now that you understand the differences between TAM, SAM, and SOM, let’s dive into the process of calculating your Share of Market (SOM). This step-by-step guide integrates your Ideal Customer Profile (ICP), Serviceable Addressable Market (SAM), and sales capacity to arrive at a clear and actionable SOM.
The first step is to define your Ideal Customer Profile (ICP) - the customers who are most likely to benefit from your product or service. For B2B businesses, this involves focusing on three main areas:
To refine your ICP specifically for SOM calculations, use intent data to identify accounts actively researching relevant topics or solutions. Additionally, leverage historical data from your CRM to validate and fine-tune your ICP.
| ICP Category | Key Data Points | Purpose in SOM Calculation |
|---|---|---|
| Firmographics | Industry, company size, geography | Defines the boundaries of the SAM |
| Technographics | IT stack, spending habits | Pinpoints accounts with high buying potential |
| Behavioral | Growth stage, intent signals | Identifies accounts ready for immediate engagement |
| Operational | Budget constraints, decision-making | Determines the realistic portion of the market |
Once your ICP is defined, the next step is narrowing your market reach to estimate your SAM. This involves filtering your Total Addressable Market (TAM) based on factors like geography, product features, distribution channels, and pricing.
For a more accurate estimate, use a bottom-up approach. Multiply the number of potential customers that match your ICP by the average revenue per customer (or Annual Contract Value). This method ensures your SAM reflects both the size of the market and the revenue potential.
Key considerations for SAM include:
In B2B settings, technographic and spending data are especially useful for refining your SAM. You can also validate your estimates by cross-referencing analyst reports from firms like Gartner or Forrester.
Be sure to exclude market segments you cannot serve due to factors like language barriers, regulatory restrictions, or distribution challenges. Use your CRM and sales analytics to calculate your average account value, which acts as a multiplier for the number of potential customers.
With your ICP and SAM in place, you can now calculate your SOM. This step involves assessing both internal constraints, such as sales capacity, and external factors, like market competition. For B2B companies, a bottom-up approach using actual sales data is often the most reliable.
Start by evaluating your sales velocity. Look at metrics like your average sales cycle length and win rates to estimate how many accounts you can realistically close within a year. Next, consider resource limitations - determine the maximum number of clients your sales and customer success teams can effectively manage. Additionally, analyze competitive gaps to identify areas where your business has an edge, such as underserved segments or unique value propositions.
If your company has been operating for a while, validate your SOM by using historical data. For example, divide last year’s revenue by last year’s SAM to calculate your current market share. Apply this percentage to your projected SAM to estimate SOM for the upcoming year. To avoid overestimating, back your assumptions with thorough sales capacity and competitive analysis.
| Factor | Role in SOM Calculation | B2B Data Source |
|---|---|---|
| Sales Capacity | Determines how many accounts can be serviced | Internal CRM / Sales Quotas |
| Win Rate | Identifies the percentage of deals that convert | Historical Sales Analytics |
| Competitive Share | Highlights segments already captured by rivals | Market Research Reports |
| Geographic Reach | Filters market to regions you can target | Logistics & Distribution Data |
| Technographics | Identifies high-propensity accounts | HG Insights / Data Enrichment Tools |
Calculating your SOM (Serviceable Obtainable Market) manually can be a challenge, especially when you're pulling data from various sources. Leadsforge simplifies this process by using AI to pinpoint customers that match your Ideal Customer Profile (ICP) and multiplying that number by your average revenue per customer. This bottom-up approach streamlines the calculation process and sets the stage for more precise lead generation powered by AI.
What sets Leadsforge apart is its ability to refine your SOM by filtering data based on firmographics and technographics. For instance, if your ICP focuses on mid-market SaaS companies in the United States with 100–500 employees using Salesforce, the platform identifies only those accounts. It excludes companies outside your geographic or technological scope, helping you avoid overestimations that often come with generic industry reports.
Leadsforge operates like a smart search engine tailored for lead generation. You simply describe your ideal customer in a chat-like interface, and the AI delivers verified lead lists that meet your ICP requirements. Its waterfall enrichment feature automatically gathers crucial contact details such as LinkedIn profiles, valid email addresses, and phone numbers - eliminating the need for tedious manual prospecting.
To ensure accuracy, Leadsforge uses real-time verification to confirm that your leads are up-to-date. This means your SOM calculations are always grounded in reliable data. With enriched data in hand, the platform further sharpens your market segmentation to align perfectly with your goals.
One of the standout tools in Leadsforge is its company lookalike search. This feature identifies new prospects that resemble your current high-value customers. For example, if your best clients are fintech firms using HubSpot, the lookalike tool finds similar companies you haven’t yet approached. This ensures you focus on areas where your product or service already has a strong fit.
Another useful feature is the company followers search. This tool highlights prospects already engaging with key industry players, competitors, or thought leaders. These accounts often display strong intent signals, making them prime candidates for your outreach. Research shows that companies leveraging deep customer insights for targeting experience an 85% sales growth advantage over their competitors. Leadsforge also incorporates lead qualification and intent signals to help you prioritize accounts actively showing buying interest - an essential factor when your sales team has limited capacity to pursue multiple deals at once.
Once you've pinpointed your SOM, Leadsforge seamlessly integrates with Salesforge, enabling you to act on your insights without missing a beat. This integration lets you launch personalized cold email and LinkedIn campaigns directly from the platform - no need to export data or juggle multiple tools. By focusing your outreach on high-potential accounts, you can maximize your sales and marketing efforts while avoiding wasted energy on leads that aren’t within reach.
SOM (Serviceable Obtainable Market) plays a key role in creating accurate revenue forecasts and making smarter decisions about where to allocate resources. It focuses on the segment of the market you can realistically capture, taking into account your sales capacity, competitive landscape, and past performance. When calculated correctly, SOM helps set achievable sales quotas, align your team's efforts, and guide marketing budgets. This realistic market evaluation forms the foundation for the strategies discussed earlier.
The shift toward data-driven selling is gaining momentum. Gartner predicts that by 2025, 60% of B2B sales organizations will move away from relying on experience and intuition, favoring data-driven approaches instead. Companies that base their market sizing on their Ideal Customer Profile (ICP) see a 68% higher win rate. SOM analysis is now a competitive necessity, helping businesses avoid overspending in markets that are already saturated while uncovering untapped opportunities with unmet demand.
To keep up with these trends, efficient tools are essential. Leadsforge is a standout example, offering AI-powered lead generation with detailed, account-level insights. Instead of manually piecing together data from multiple sources, Leadsforge delivers verified lead lists tailored to your ICP. These lists are enriched with technographic and firmographic data, which sharpens your SOM calculations. Features like lookalike search and intent signals allow you to identify accounts most likely to convert, while its integration with Salesforge enables immediate, personalized outreach - saving time and boosting precision.
The Serviceable Obtainable Market (SOM) represents the portion of the market your business can realistically capture within a specific timeframe. It’s the most practical metric for setting sales goals and planning strategies. On the other hand, the Total Addressable Market (TAM) reflects the largest possible market opportunity - essentially, the entire global customer base you could target if there were no limitations. Somewhere in between lies the Serviceable Addressable Market (SAM), which focuses on the segment of the market you can serve based on factors like geography, product capabilities, or target industries.
Here’s a quick breakdown:
Focusing on SOM helps businesses like Leadsforge zero in on realistic revenue opportunities, ensuring their sales and marketing efforts are targeted and efficient.
To calculate your Serviceable Obtainable Market (SOM), focus on factors that realistically reflect your ability to capture a share of the market right now. Here are some key elements to consider:
You’ll also want to assess your available resources - financial capital, manpower, and logistics. These are the nuts and bolts of serving your customers effectively. A clear SOM calculation gives you a realistic picture of the revenue you can aim for, helping you set goals that are actually within reach.
Tools like Leadsforge can simplify this process. They provide data on market size, customer segments, and buying intent, ensuring your SOM aligns with the actual conditions in your market.
AI-powered tools like Leadsforge take the guesswork out of calculating your Serviceable Obtainable Market (SOM). By automating data analysis, it delivers dynamic, data-backed insights that go beyond traditional methods. Using machine learning, Leadsforge processes historical metrics like revenue, win rates, and deal sizes to predict the realistic portion of the Serviceable Addressable Market (SAM) your business can actually secure. What sets it apart is its ability to continuously refine these estimates by incorporating new sales and lead data as they come in.
Leadsforge doesn’t stop there - it pulls in real-time data from sources like LinkedIn activity, website traffic, and CRM updates to fine-tune your SOM calculations. This shift from static assumptions to predictive analytics provides a sharper, more actionable picture of your revenue potential in U.S. dollars. With this level of clarity, you can make smarter, faster decisions to optimize your B2B strategy.