TAM, SAM, and SOM are essential market-sizing concepts that help businesses understand their market potential and focus their efforts effectively:
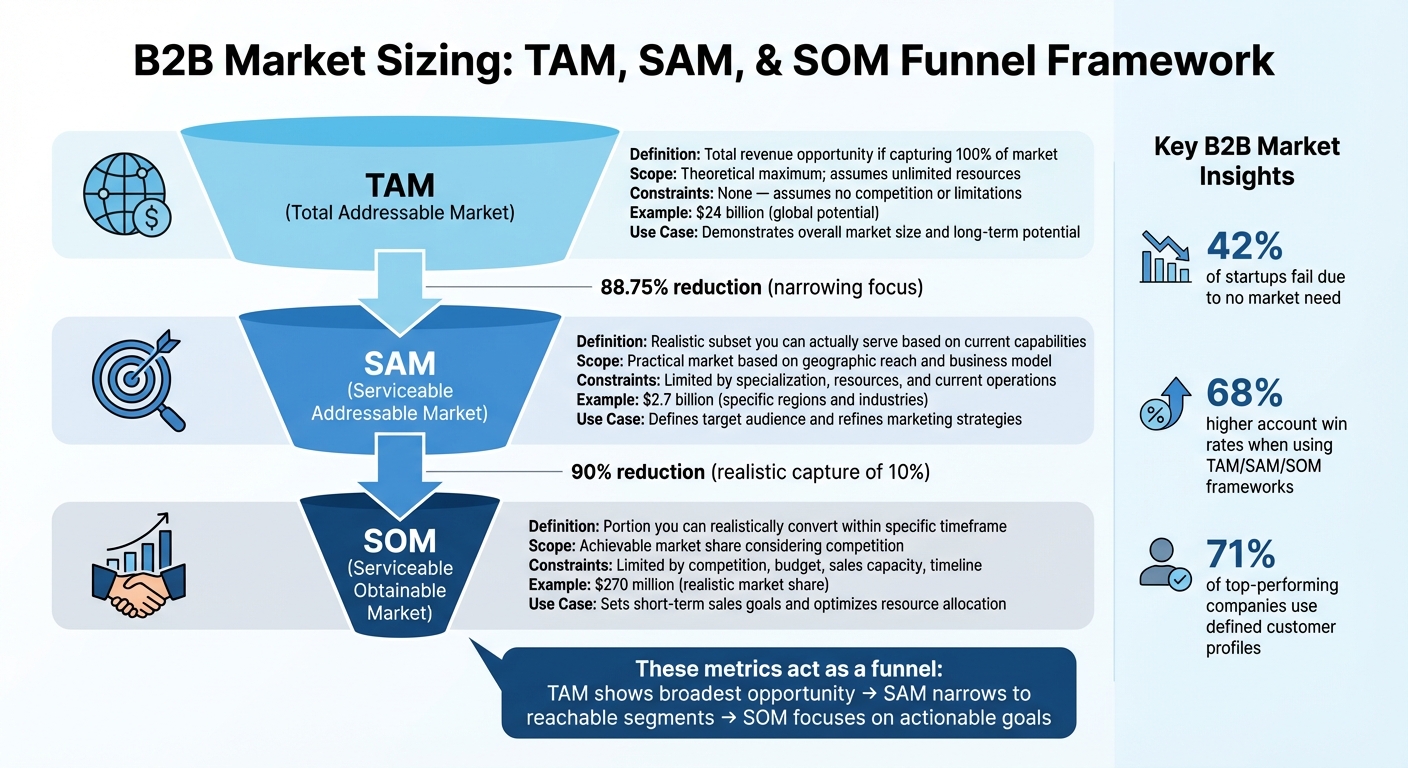
These metrics act as a funnel:
For example, a SaaS company might calculate:
TAM vs SAM vs SOM Market Sizing Framework Comparison
Total Addressable Market (TAM) represents the maximum revenue your business could generate if it captured 100% of the market demand - assuming no competition, geographic restrictions, or resource constraints. Essentially, it’s the ultimate revenue potential if every possible customer worldwide adopted your product or service.
For B2B technology products, TAM is typically calculated by multiplying the number of potential customers by the annual price per user (or "seat"). This number helps businesses define their vision by quantifying the upper limit of revenue they could achieve.
Here’s why TAM matters: 42% of startups fail because there’s no market need for their product. Understanding TAM ensures you’re entering a market with sufficient demand to justify your investment. It informs critical decisions around funding, resource allocation, and product development. Take the Artificial Intelligence Software market as an example - valued at $16.98 billion in 2024, it’s projected to grow to $80.6 billion by 2031, with a compound annual growth rate (CAGR) of 29.64%. Such data highlights the vast TAM for AI solutions and validates the opportunity for businesses in this space.
Additionally, TAM helps you evaluate product-market fit and pinpoint which markets to prioritize. For instance, if you’re creating a lead generation platform, knowing that nearly 61% of SaaS companies struggle with generating traffic and leads confirms that your TAM is large and addresses a real, pressing pain point.
TAM offers a big-picture view of market potential, shaping long-term growth strategies. While it’s not a revenue forecast or a detailed business plan, it’s an invaluable tool for determining whether scaling is feasible and identifying where to focus expansion efforts.
Investors, in particular, pay close attention to TAM when assessing startups. Consider this: The SaaS Capital Index™ currently stands at 7.0 times annualized revenue, indicating that investors are willing to pay high multiples for SaaS companies with strong market opportunities. In 2024, global software venture capital investments reached $125 billion - a 28.8% increase over 2023 - showing that significant capital flows into businesses operating in large, growing markets.
For strategic planning, TAM allows you to build a segmented model, breaking down the market by geography, industry, or business size. This helps prioritize which segments to target first and allocate resources effectively. However, it’s essential to apply realistic constraints to your TAM calculation. Rather than viewing the market as a broad, generic opportunity, focus on the specific problem your product solves for a particular group of customers.
Understanding TAM isn’t just about estimating market size - it’s about making informed, strategic decisions. Let’s look at a bottom-up TAM calculation for a B2B lead generation SaaS product, such as Leadsforge. This method is often more credible to investors because it’s based on specific, grounded assumptions rather than broad industry estimates.
This $24 billion represents the maximum revenue potential if every qualifying business adopted Leadsforge. Once TAM provides an understanding of the total opportunity, the next step is to narrow the focus to reachable market segments with SAM (Serviceable Addressable Market).
The Serviceable Addressable Market (SAM) represents the portion of your Total Addressable Market (TAM) that your company can realistically target and serve based on its current capabilities, resources, and constraints. While TAM is the theoretical maximum market size if you could sell to everyone, SAM takes a more grounded approach, focusing on the customers you can actually reach with your existing products, geographic presence, distribution channels, and operational setup.
Think of SAM as your practical playing field. It reflects the real-world conditions your business operates within, helping you set achievable goals instead of chasing an overly ambitious total market. For B2B companies, SAM offers a clearer view of revenue potential. By concentrating on the segments within your SAM, you can focus your efforts where your business has a genuine edge - this often leads to better conversion rates, more efficient use of marketing dollars, and stronger customer relationships. Let’s explore how SAM shapes your market strategy with concrete examples.
To refine your TAM into SAM, you’ll need to evaluate factors like geographic reach, product limitations, and your business model. Your business model plays a significant role in shaping SAM. Take, for example, a project management SaaS company looking to expand into the manufacturing sector. They initially estimated a TAM of $6 billion, based on 600,000 U.S. manufacturing businesses, each with a potential annual revenue of $10,000 per customer. However, they realized their software worked best for manufacturers with 50–100 employees and minimal customization needs. After further research, they found that only 200,000 businesses fit these criteria, reducing their SAM to $2 billion. That’s a 67% reduction from TAM to SAM, highlighting the importance of identifying your product’s ideal market segment.
Other factors like distribution channels and regulatory requirements can also shrink your SAM. For instance, if your sales rely exclusively on channel partners, your SAM is limited to the regions where those partners operate. Similarly, compliance standards and certifications may exclude certain customer segments, even if there’s demand for your product. Let’s look at an example to see how these constraints shape SAM in practice.
Let’s revisit the Leadsforge example to see how SAM is calculated in a real-world context. Starting with a TAM of $24 billion, the company narrowed its focus to mid-sized tech companies in North America, where their sales team operates and their product-market fit is strongest. Leadsforge’s platform is tailored for companies with 100–500 employees that actively run outbound sales campaigns and need advanced lead intelligence. Market research revealed that approximately 150,000 tech companies in North America fit this profile, with an average of 15 users per company.
Using their pricing model of $1,200 per seat annually, the SAM calculation looks like this:
150,000 companies × 15 seats × $1,200 per seat = $2.7 billion.
This represents an 88.75% reduction from the original $24 billion TAM. Rather than seeing this reduction as a limitation, it provides strategic clarity by focusing on a realistic and actionable target market.
"When you get all these data points aggregated together at an account-level, and all the accounts add up to your TAM, SAM, SOM, that's fantastic. Now you have a precise solution you can actually use. That's why we are a leader in Revenue Growth Intelligence that drives revenue growth, customer retention, operational efficiency, and, most importantly, strategic alignment across the entire organization."
The Serviceable Obtainable Market (SOM) represents the portion of your Serviceable Addressable Market (SAM) that you can realistically convert into paying customers within a set timeframe. While TAM (Total Addressable Market) outlines the total opportunity and SAM narrows it to the segment you can serve, SOM drills down further to define the market share you can actually achieve. In short, TAM and SAM reflect potential, whereas SOM focuses on what’s realistically achievable within your resources and constraints.
SOM helps you face the realities of market capture. Competitors already hold a share of the market, your sales team has limits, and your marketing budget isn’t infinite. For example, a realistic SOM estimate might show that you can secure 5-10% of your SAM over three years. This provides a grounded foundation for revenue projections, steering clear of overly ambitious goals.
Several factors shape your SOM, including how well your product stands out from competitors, the capacity of your sales and marketing teams, the maturity of your product, and any operational challenges. For B2B tech companies, these constraints are often magnified. Enterprise solutions, for instance, may take 6-18 months from introduction to purchase decision, directly influencing how quickly you can capture market share. By understanding these limitations, you can zero in on the "smallest viable market" that your business can realistically dominate. A clear SOM estimation helps align everyday sales efforts with broader strategic goals.
SOM doesn’t just define market size - it turns it into actionable plans. It helps set realistic revenue targets, guides decisions on team size, and focuses marketing efforts on activities that deliver the best return. This precision is crucial. For instance, only 8% of marketers use advanced buyer and account intelligence models to inform their strategies. Without such insights, many companies risk misallocating resources.
Another key benefit of SOM is knowing when to say "no." By mapping out your SOM, you can identify prospects that don’t fit your ideal customer profile and avoid wasting resources on unlikely opportunities. This focus ensures your team prioritizes deals where your product’s strengths make a real difference. SOM analysis can also refine your pricing strategy. By identifying segments you can realistically win, you can adjust pricing to maximize both profitability and market share.
Let’s look at Leadsforge as an example to see how SOM plays out in practice. Starting with a SAM of $2.7 billion, the company evaluated what they could realistically achieve given their team size, competitive environment, and product maturity. Using a top-down approach, they estimated capturing 10% of their SAM over three years, which equates to: $2.7 billion × 10% = $270 million SOM.
To confirm this, they also used a bottom-up approach. Their sales team analyzed conversion rates and determined they could realistically convert 10% of the 150,000 companies in their SAM, or about 15,000 customers. With an average of 15 seats per company at $1,200 per seat annually, the calculation became: 15,000 companies × 15 seats × $1,200 = $270 million. The consistency between both methods reinforced confidence in their SOM estimate and gave them a clear revenue target for their strategy.
This $270 million SOM, though just a slice of the overall market, became the cornerstone of Leadsforge’s operational decisions. It influenced how many sales reps to hire, which marketing channels to prioritize, and which product features to enhance. As market conditions and competition evolve, Leadsforge regularly revisits its SOM calculation to ensure their strategy stays aligned with reality.
Understanding TAM, SAM, and SOM is crucial for making informed decisions in B2B sales. Each metric serves a unique purpose, and knowing when and how to use them can be the difference between chasing unattainable goals and building a focused strategy for growth. Before diving into how to calculate these metrics, let’s break down their key distinctions.
TAM gives you the big-picture perspective. This is the total market opportunity - essentially, what the market would be worth if you could sell to every single potential customer, assuming no competition or resource limitations. While TAM is great for showcasing market potential to investors, it doesn’t dictate where to focus your efforts right now.
SAM brings things into focus. It narrows down TAM to the market segments you can realistically target and serve based on your current resources, geographic reach, and business model. SAM helps identify your ideal audience and aligns your strategy with your strengths, making it a practical tool for high-intent marketing.
SOM is where action meets reality. SOM is the portion of SAM you can realistically convert into paying customers within a specific timeframe. It accounts for factors like competition, sales capacity, and budget constraints. This metric is key for setting short-term sales goals, prioritizing leads, and maximizing ROI.
The value of understanding these metrics is clear. Companies that use TAM, SAM, and SOM frameworks to define their Ideal Customer Profile (ICP) see 68% higher account win rates because they focus their resources on accounts with the highest likelihood of conversion. By moving from the theoretical (TAM) to the actionable (SOM), you can direct your efforts where they’ll have the most impact.
| Feature | TAM (Total Addressable Market) | SAM (Serviceable Addressable Market) | SOM (Serviceable Obtainable Market) |
|---|---|---|---|
| Definition | The total market demand for your product or service | The portion of TAM you can realistically target and serve | The share of SAM you can realistically convert into customers |
| Scope | Theoretical maximum; total revenue opportunity | A practical subset of TAM based on your capabilities and reach | Achievable market share within SAM, considering competition and resources |
| Constraints | Assumes unlimited resources and full market capture | Limited by your current business model, specialization, and geographic reach | Limited by competition, budget, sales capacity, and timeframe |
| Use in B2B Lead Generation | Demonstrates overall market size and long-term potential | Helps define your target audience and refine marketing strategies | Establishes short-term sales priorities and optimizes resource allocation |
Calculating TAM (Total Addressable Market), SAM (Serviceable Available Market), and SOM (Serviceable Obtainable Market) requires reliable data and a solid grasp of your market. There are two main ways to approach this: top-down or bottom-up.
The top-down method starts with broad market data, often sourced from industry reports like those from Gartner or Forrester. Here’s how it works:
While this method is quick and useful for broad assessments, it often relies on generalized data, which can lead to overestimations - especially for niche markets. Be sure to define your geographic scope (global, regional, or local) and cite your sources to ensure accuracy and credibility.
If you’re looking for more precise estimates, the bottom-up method might be a better fit.
The bottom-up approach builds market size estimates from the ground up, using primary data like surveys, sales records, and conversion rates. Here’s how it’s done:
Though more time-intensive, this approach provides a more accurate picture, which is why investors often favor it.

Both methods can be enhanced with the right tools, and Leadsforge demonstrates how technology simplifies market sizing. Instead of manually analyzing industry reports or outdated databases, Leadsforge allows you to input your ICP into a chat-like interface. Its AI then generates highly targeted and verified lead lists tailored to your criteria. This eliminates the risk of relying on overly broad or unreliable data - a common issue that can skew projections.
For instance, if you’re calculating SAM for a sales enablement tool aimed at mid-market SaaS companies in the United States with 50–200 employees, Leadsforge can pinpoint exactly how many companies match those parameters. Features like company lookalike search and follower search help expand your addressable market by identifying similar prospects. Additionally, its lead qualification tools and intent signals aid in estimating SOM by highlighting which accounts are most likely to convert. With real-time data enrichment that includes LinkedIn profiles, email addresses, and phone numbers, Leadsforge enables bottom-up calculations rooted in actual, reachable prospects. This kind of precision helps set realistic sales goals and allocate resources where they’ll have the most impact.
Market size metrics are only as useful as the actions they inspire. The real value of applying TAM (Total Addressable Market), SAM (Serviceable Available Market), and SOM (Serviceable Obtainable Market) lies in their ability to refine targeting, streamline priorities, and allocate resources where they can generate the most revenue. This approach transforms broad market data into actionable, revenue-focused strategies.
A sharp ICP is the foundation for accurate market sizing. Start by analyzing your TAM to identify industries, company sizes, and regions with the biggest opportunities. Then, narrow down your SAM to focus on segments you can realistically serve. This step ensures you acknowledge your limitations and zero in on prospects you can effectively convert. For example, if your TAM includes all companies using CRM software, your SAM might narrow to mid-market B2B SaaS companies in North America, specifically those with 50–200 employees already using modern CRM tools.
Defining your SOM - the portion of your SAM you can realistically capture - is just the beginning. To make the most of it, prioritizing leads becomes essential. In today’s B2B landscape, buyers often conduct extensive research before engaging with sales. Traditional lead qualification methods like BANT (Budget, Authority, Need, Timeline) or basic demographic filters can feel outdated and inconsistent. Instead, use a more dynamic approach by incorporating behavioral signals and engagement data. Look for indicators like website activity or content interactions to gauge intent. This ensures your sales team focuses on leads with the highest potential to convert, saving time and resources.
Your SAM can also guide your resource allocation strategy. After identifying specific SAM segments - such as enterprise healthcare, mid-market fintech, or small business e-commerce - evaluate which ones deserve the most investment. Consider factors like average deal size, sales cycle length, competitive landscape, and historical win rates. Allocate resources - whether budget, team members, or marketing spend - based on each segment’s potential revenue and conversion likelihood. For example, if one segment consistently delivers higher returns and conversion rates, it makes sense to channel more funding into paid ads, content campaigns, and sales efforts in that area. These decisions naturally enhance your targeting strategy, setting the stage for advanced tools and platforms.
Once your segments are refined, tools like Leadsforge help execute your strategy with precision. Instead of manually sifting through databases or relying on outdated lead lists, you simply describe your SAM criteria - such as "mid-market SaaS companies in the U.S. with 50–200 employees using modern CRM systems" - through a user-friendly, chat-like interface. Leadsforge then generates a verified lead list that aligns with your criteria. Additional features, like the company lookalike search, expand your market by identifying similar prospects you might have overlooked. Integrated lead qualification and intent signals help prioritize your SOM, ensuring you focus on leads with the highest potential. Plus, real-time data enrichment provides LinkedIn profiles, email addresses, and phone numbers, making outreach efforts more effective by targeting reachable prospects rather than theoretical ones.
This guide has explored how TAM, SAM, and SOM play a crucial role in shaping strategic market decisions. Mastering these frameworks allows businesses to allocate resources wisely, replacing guesswork with data-driven clarity. By identifying target segments and filtering out less promising opportunities, companies can focus their efforts where they matter most.
In fact, 71% of companies that consistently surpass their revenue and lead goals do so by using clearly defined customer profiles as part of their sales and marketing strategies.
Here’s how it works: TAM outlines the total market opportunity, SAM narrows it down to the segments you can realistically serve, and SOM sets actionable goals for daily decisions. This approach helps businesses prioritize leads and allocate budgets effectively. Companies that implement these frameworks report 68% higher account win rates and generate 30% more revenue from their marketing efforts.
Tools like Leadsforge make these concepts practical. By describing your SAM criteria through a simple chat interface, the platform delivers verified leads tailored to your specifications. Features such as lookalike searches expand your reach, while intent signals and lead qualification tools help pinpoint your SOM - the prospects most likely to convert. With real-time data enrichment providing LinkedIn profiles, email addresses, and phone numbers, you’re not just identifying opportunities - you’re prepared to act on them immediately. This level of precision turns insights into actionable sales strategies.
The most successful companies don’t just understand their market - they act on it. By applying TAM, SAM, and SOM, they focus on high-value leads and make informed decisions at every level. With tools like Leadsforge, these frameworks become more than just concepts; they become the foundation for precise, results-driven action.
When you're trying to gauge the potential of your market, TAM, SAM, and SOM are three key concepts that can guide your strategy.
Each of these layers serves a distinct purpose. TAM gives you a sense of the overall market size and potential. SAM helps you narrow your focus to a specific target audience that fits your business model. Finally, SOM sets the stage for achievable, short-term growth goals.
By understanding and applying these frameworks, businesses can make smarter decisions about where to invest their time and resources. Whether it's refining lead generation, honing your sales strategy, or prioritizing market segments, TAM, SAM, and SOM provide a clear roadmap for aligning efforts with opportunities.
When calculating your SOM (Serviceable Obtainable Market), consider key elements like your sales capacity, the level of competition, available resources, and the cost of acquiring customers. Rely on data-driven techniques, such as evaluating market share, performing bottom-up calculations, and studying competitors, to ensure your SOM is both practical and actionable.
Focus on areas where your business can make the biggest impact while maintaining competitiveness. This strategy allows you to allocate resources wisely and seize the best sales opportunities.
Leadsforge takes the guesswork out of market sizing by delivering precise data and analytics to help you define your TAM (Total Addressable Market), SAM (Serviceable Addressable Market), and SOM (Serviceable Obtainable Market). With this clarity, you can zero in on the right audience, allocate your resources wisely, and set achievable sales targets.
Using Leadsforge's tools, you can spot markets with high potential, fine-tune your lead generation strategies, and improve your sales performance. It’s a practical way to turn insights into action and align your strategy for better results.